> ## Documentation Index
> Fetch the complete documentation index at: https://docs.laozhang.ai/llms.txt
> Use this file to discover all available pages before exploring further.
# Usage Logs
> How to view and analyze API usage logs
## Access Usage Logs
### 1. Console Access
Visit [Laozhang API Console](https://api2.laozhang.ai) and log in
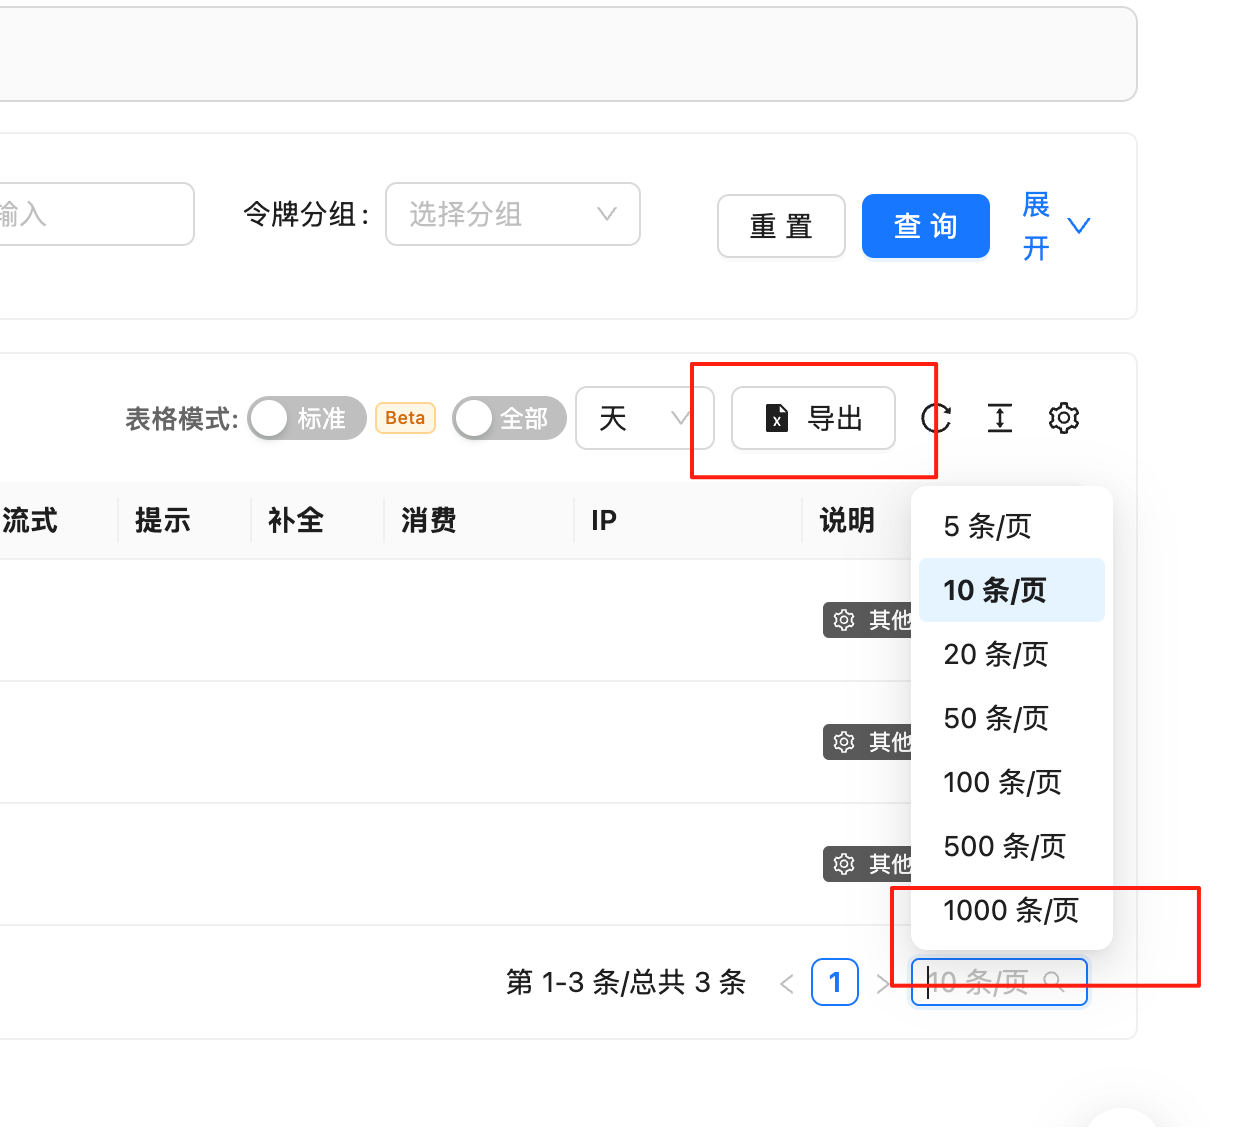 Click "Usage Logs" in the left menu
In the log list you can view:
* **Request Time**: When the request occurred
* **Model Used**: Which model was called
* **Token Count**: Number of tokens used
* **Cost**: This request's cost
* **Request Status**: Success/failure status
* **Request Parameters**: Detailed request information
### 2. API Query
Get usage logs via API:
```python theme={null}
import requests
api_url = "https://api2.laozhang.ai/v1/usage/logs"
headers = {
"Authorization": "Bearer Your API Key"
}
params = {
"start_date": "2024-01-01",
"end_date": "2024-01-31",
"limit": 100
}
response = requests.get(api_url, headers=headers, params=params)
logs = response.json()
for log in logs['data']:
print(f"Time: {log['timestamp']}")
print(f"Model: {log['model']}")
print(f"Tokens: {log['tokens']}")
print(f"Cost: ${log['cost']}")
print("---")
```
## Log Information Details
### Basic Information
| Field | Description | Example |
| -------------- | ----------------- | --------------------- |
| **Request ID** | Unique identifier | `req_123456789` |
| **Timestamp** | Request time | `2024-01-15 14:30:25` |
| **Model** | Model used | `gpt-4-turbo` |
| **Status** | Request status | `success` / `error` |
### Usage Statistics
| Field | Description | Calculation Method |
| --------------------- | ------------------ | ---------------------------------- |
| **Prompt Tokens** | Input token count | Calculated based on input text |
| **Completion Tokens** | Output token count | Calculated based on generated text |
| **Total Tokens** | Total token count | Prompt + Completion |
| **Cost** | Request cost | Token count × unit price |
### Request Details
| Field | Description | Use Case |
| ---------------------- | ------------------- | --------------------------------------------------- |
| **API Key** | Key used | Differentiate between different application sources |
| **IP Address** | Request source IP | Security audit, access analysis |
| **User Agent** | Client information | Technical support, issue troubleshooting |
| **Request Parameters** | Detailed parameters | Reproduce issues, optimize requests |
### Error Information
When request fails, additional information is recorded:
| Field | Description | Example |
| ----------------- | -------------------------- | ---------------------------------------- |
| **Error Code** | Error type code | `insufficient_balance` |
| **Error Message** | Error description | "Insufficient balance" |
| **Error Details** | Detailed error information | Stack trace, parameter validation errors |
## Log Filtering and Search
### Time Range Filtering
```python theme={null}
# Filter by date range
params = {
"start_date": "2024-01-01",
"end_date": "2024-01-31"
}
```
### Model Filtering
```python theme={null}
# View usage for specific model
params = {
"model": "gpt-4-turbo",
"start_date": "2024-01-01",
"end_date": "2024-01-31"
}
```
### Status Filtering
```python theme={null}
# View only failed requests
params = {
"status": "error",
"start_date": "2024-01-01",
"end_date": "2024-01-31"
}
```
### Advanced Search
```python theme={null}
# Combination filtering
params = {
"model": "gpt-4-turbo",
"status": "success",
"min_tokens": 1000, # Minimum token count
"max_tokens": 5000, # Maximum token count
"start_date": "2024-01-01",
"end_date": "2024-01-31",
"limit": 100,
"offset": 0
}
```
## Usage Analysis
### Cost Analysis
Analyze usage costs:
```python theme={null}
import pandas as pd
import matplotlib.pyplot as plt
# Get log data
logs_df = pd.DataFrame(logs['data'])
# Calculate cost by model
model_costs = logs_df.groupby('model')['cost'].sum()
print("Cost by model:")
print(model_costs)
# Plot
model_costs.plot(kind='bar', title='Cost by Model')
plt.ylabel('Cost ($)')
plt.show()
```
### Usage Trend Analysis
```python theme={null}
# Convert timestamp to datetime
logs_df['date'] = pd.to_datetime(logs_df['timestamp']).dt.date
# Calculate daily usage
daily_usage = logs_df.groupby('date').agg({
'tokens': 'sum',
'cost': 'sum',
'request_id': 'count'
})
daily_usage.columns = ['Total Tokens', 'Total Cost', 'Request Count']
print(daily_usage)
# Plot trend chart
daily_usage.plot(subplots=True, figsize=(12, 8))
plt.show()
```
### Peak Time Analysis
```python theme={null}
# Extract hour information
logs_df['hour'] = pd.to_datetime(logs_df['timestamp']).dt.hour
# Calculate requests by hour
hourly_requests = logs_df.groupby('hour').size()
# Find peak hours
peak_hour = hourly_requests.idxmax()
print(f"Peak hour: {peak_hour}:00, requests: {hourly_requests[peak_hour]}")
# Plot hour distribution
hourly_requests.plot(kind='bar', title='Request Distribution by Hour')
plt.xlabel('Hour')
plt.ylabel('Request Count')
plt.show()
```
### Error Rate Analysis
```python theme={null}
# Calculate success and failure counts
status_counts = logs_df['status'].value_counts()
error_rate = status_counts.get('error', 0) / len(logs_df) * 100
print(f"Success rate: {100 - error_rate:.2f}%")
print(f"Failure rate: {error_rate:.2f}%")
# Analyze error types
error_logs = logs_df[logs_df['status'] == 'error']
error_types = error_logs['error_code'].value_counts()
print("\nError type distribution:")
print(error_types)
```
## Export Logs
### Export to CSV
```python theme={null}
# Export full log
logs_df.to_csv('usage_logs.csv', index=False)
# Export filtered results
filtered_logs = logs_df[logs_df['model'] == 'gpt-4-turbo']
filtered_logs.to_csv('gpt4_usage_logs.csv', index=False)
```
### Export to JSON
```python theme={null}
import json
# Export to JSON format
with open('usage_logs.json', 'w') as f:
json.dump(logs['data'], f, indent=2)
```
### Generate Report
```python theme={null}
from datetime import datetime
def generate_usage_report(logs_df, output_file='usage_report.txt'):
"""Generate usage report"""
report = []
report.append("=" * 60)
report.append(f"Usage Report")
report.append(f"Generation time: {datetime.now().strftime('%Y-%m-%d %H:%M:%S')}")
report.append("=" * 60)
report.append("")
# Summary statistics
report.append("Summary Statistics")
report.append("-" * 60)
report.append(f"Total requests: {len(logs_df)}")
report.append(f"Total tokens: {logs_df['tokens'].sum():,}")
report.append(f"Total cost: ${logs_df['cost'].sum():.2f}")
report.append(f"Average cost per request: ${logs_df['cost'].mean():.4f}")
report.append("")
# Model usage
report.append("Model Usage Statistics")
report.append("-" * 60)
model_stats = logs_df.groupby('model').agg({
'request_id': 'count',
'tokens': 'sum',
'cost': 'sum'
})
for model, stats in model_stats.iterrows():
report.append(f"{model}:")
report.append(f" Requests: {stats['request_id']}")
report.append(f" Tokens: {stats['tokens']:,}")
report.append(f" Cost: ${stats['cost']:.2f}")
report.append("")
# Date statistics
report.append("Daily Statistics")
report.append("-" * 60)
daily_stats = logs_df.groupby('date').agg({
'request_id': 'count',
'cost': 'sum'
})
for date, stats in daily_stats.iterrows():
report.append(f"{date}: {stats['request_id']} requests, ${stats['cost']:.2f}")
# Write to file
with open(output_file, 'w') as f:
f.write('\n'.join(report))
print(f"Report generated: {output_file}")
# Generate report
generate_usage_report(logs_df)
```
## Automated Monitoring
### Set Up Alert System
```python theme={null}
def check_usage_anomaly(logs_df):
"""Check for usage anomalies"""
# Check if cost spike occurred
daily_cost = logs_df.groupby('date')['cost'].sum()
avg_cost = daily_cost.mean()
std_cost = daily_cost.std()
# If today's cost exceeds average + 2 standard deviations, send alert
today_cost = daily_cost.iloc[-1]
if today_cost > avg_cost + 2 * std_cost:
send_alert(f"Cost abnormal! Today: ${today_cost:.2f}, Average: ${avg_cost:.2f}")
# Check if error rate spike occurred
recent_logs = logs_df.tail(100)
error_rate = (recent_logs['status'] == 'error').sum() / len(recent_logs)
if error_rate > 0.1: # Error rate over 10%
send_alert(f"High error rate! Current: {error_rate*100:.1f}%")
def send_alert(message):
"""Send alert notification"""
print(f"ALERT: {message}")
# Can integrate email, SMS, Slack and other notification methods
```
### Regular Report Generation
```python theme={null}
import schedule
import time
def daily_report_task():
"""Daily report task"""
# Get yesterday's logs
yesterday = (datetime.now() - timedelta(days=1)).strftime('%Y-%m-%d')
params = {
"start_date": yesterday,
"end_date": yesterday
}
# Get logs
response = requests.get(api_url, headers=headers, params=params)
logs = response.json()
logs_df = pd.DataFrame(logs['data'])
# Generate report
generate_usage_report(logs_df, f'report_{yesterday}.txt')
# Check anomalies
check_usage_anomaly(logs_df)
# Set up scheduled task: run daily at 9 AM
schedule.every().day.at("09:00").do(daily_report_task)
# Keep running
while True:
schedule.run_pending()
time.sleep(60)
```
## Common Questions
**Log Retention Policy:**
* Standard users: 30 days
* Professional users: 90 days
* Enterprise users: 1 year
**Extended Retention:**
* Can purchase extended log retention service
* Support custom retention period
* Support historical log export
**Filtering by API Key:**
In console:
1. Select "Filter by API Key" on log page
2. Choose the API Key you need to view
3. View filtered results
Via API:
```python theme={null}
params = {
"api_key_id": "key_123456",
"start_date": "2024-01-01",
"end_date": "2024-01-31"
}
```
**Log Deletion Policy:**
* Logs cannot be manually deleted (for audit and billing purposes)
* Logs are automatically deleted after retention period expires
* Can contact support for special deletion requests
**Privacy Protection:**
* Logs do not contain sensitive information (like prompts)
* Only statistical information and metadata are recorded
* Can enable "Privacy Mode" to reduce log details
**Timestamp Format:**
* All timestamps use UTC time
* Console can display local time
* API returns UTC timestamps
**Convert to Local Time:**
```python theme={null}
from datetime import datetime
import pytz
# UTC time
utc_time = datetime.strptime(log['timestamp'], '%Y-%m-%d %H:%M:%S')
utc_time = pytz.UTC.localize(utc_time)
# Convert to Beijing time
beijing_tz = pytz.timezone('Asia/Shanghai')
beijing_time = utc_time.astimezone(beijing_tz)
print(beijing_time)
```
**Batch Export:**
1. **Use Pagination**
```python theme={null}
all_logs = []
offset = 0
limit = 1000
while True:
params = {
"limit": limit,
"offset": offset,
"start_date": "2024-01-01",
"end_date": "2024-12-31"
}
response = requests.get(api_url, headers=headers, params=params)
logs = response.json()
if not logs['data']:
break
all_logs.extend(logs['data'])
offset += limit
```
2. **Export in Chunks**
* Export by month to avoid single file being too large
* Use compressed format to reduce storage space
* Consider using database storage instead of files
## Best Practices
### 1. Regular Monitoring
Establish regular monitoring mechanisms:
```
Daily: Check yesterday's usage and cost
Weekly: Generate weekly report, analyze trends
Monthly: Comprehensive monthly review, optimize strategy
```
### 2. Alert Configuration
Set reasonable alert thresholds:
* Cost alert: Set based on daily average + 2 standard deviations
* Error rate alert: Over 10% trigger alert
* Token alert: Abnormally high single request tokens
### 3. Data Backup
Regularly backup important logs:
* Export and save monthly logs
* Use version control to manage reports
* Consider using cloud storage for backup
### 4. Privacy Protection
Protect sensitive information:
* Don't log detailed request content
* Enable log encryption
* Control log access permissions
* Regularly clean up old logs
## Related Resources
* [Token Management](/en/faq/token-management) - Learn how to manage API tokens
* [Insufficient Balance](/en/faq/balance-insufficient) - Handle balance issues
* [API Reference](/en/api-reference/chat-completions) - View API documentation
* [Pricing Description](/en/pricing) - Understand pricing mechanism
Click "Usage Logs" in the left menu
In the log list you can view:
* **Request Time**: When the request occurred
* **Model Used**: Which model was called
* **Token Count**: Number of tokens used
* **Cost**: This request's cost
* **Request Status**: Success/failure status
* **Request Parameters**: Detailed request information
### 2. API Query
Get usage logs via API:
```python theme={null}
import requests
api_url = "https://api2.laozhang.ai/v1/usage/logs"
headers = {
"Authorization": "Bearer Your API Key"
}
params = {
"start_date": "2024-01-01",
"end_date": "2024-01-31",
"limit": 100
}
response = requests.get(api_url, headers=headers, params=params)
logs = response.json()
for log in logs['data']:
print(f"Time: {log['timestamp']}")
print(f"Model: {log['model']}")
print(f"Tokens: {log['tokens']}")
print(f"Cost: ${log['cost']}")
print("---")
```
## Log Information Details
### Basic Information
| Field | Description | Example |
| -------------- | ----------------- | --------------------- |
| **Request ID** | Unique identifier | `req_123456789` |
| **Timestamp** | Request time | `2024-01-15 14:30:25` |
| **Model** | Model used | `gpt-4-turbo` |
| **Status** | Request status | `success` / `error` |
### Usage Statistics
| Field | Description | Calculation Method |
| --------------------- | ------------------ | ---------------------------------- |
| **Prompt Tokens** | Input token count | Calculated based on input text |
| **Completion Tokens** | Output token count | Calculated based on generated text |
| **Total Tokens** | Total token count | Prompt + Completion |
| **Cost** | Request cost | Token count × unit price |
### Request Details
| Field | Description | Use Case |
| ---------------------- | ------------------- | --------------------------------------------------- |
| **API Key** | Key used | Differentiate between different application sources |
| **IP Address** | Request source IP | Security audit, access analysis |
| **User Agent** | Client information | Technical support, issue troubleshooting |
| **Request Parameters** | Detailed parameters | Reproduce issues, optimize requests |
### Error Information
When request fails, additional information is recorded:
| Field | Description | Example |
| ----------------- | -------------------------- | ---------------------------------------- |
| **Error Code** | Error type code | `insufficient_balance` |
| **Error Message** | Error description | "Insufficient balance" |
| **Error Details** | Detailed error information | Stack trace, parameter validation errors |
## Log Filtering and Search
### Time Range Filtering
```python theme={null}
# Filter by date range
params = {
"start_date": "2024-01-01",
"end_date": "2024-01-31"
}
```
### Model Filtering
```python theme={null}
# View usage for specific model
params = {
"model": "gpt-4-turbo",
"start_date": "2024-01-01",
"end_date": "2024-01-31"
}
```
### Status Filtering
```python theme={null}
# View only failed requests
params = {
"status": "error",
"start_date": "2024-01-01",
"end_date": "2024-01-31"
}
```
### Advanced Search
```python theme={null}
# Combination filtering
params = {
"model": "gpt-4-turbo",
"status": "success",
"min_tokens": 1000, # Minimum token count
"max_tokens": 5000, # Maximum token count
"start_date": "2024-01-01",
"end_date": "2024-01-31",
"limit": 100,
"offset": 0
}
```
## Usage Analysis
### Cost Analysis
Analyze usage costs:
```python theme={null}
import pandas as pd
import matplotlib.pyplot as plt
# Get log data
logs_df = pd.DataFrame(logs['data'])
# Calculate cost by model
model_costs = logs_df.groupby('model')['cost'].sum()
print("Cost by model:")
print(model_costs)
# Plot
model_costs.plot(kind='bar', title='Cost by Model')
plt.ylabel('Cost ($)')
plt.show()
```
### Usage Trend Analysis
```python theme={null}
# Convert timestamp to datetime
logs_df['date'] = pd.to_datetime(logs_df['timestamp']).dt.date
# Calculate daily usage
daily_usage = logs_df.groupby('date').agg({
'tokens': 'sum',
'cost': 'sum',
'request_id': 'count'
})
daily_usage.columns = ['Total Tokens', 'Total Cost', 'Request Count']
print(daily_usage)
# Plot trend chart
daily_usage.plot(subplots=True, figsize=(12, 8))
plt.show()
```
### Peak Time Analysis
```python theme={null}
# Extract hour information
logs_df['hour'] = pd.to_datetime(logs_df['timestamp']).dt.hour
# Calculate requests by hour
hourly_requests = logs_df.groupby('hour').size()
# Find peak hours
peak_hour = hourly_requests.idxmax()
print(f"Peak hour: {peak_hour}:00, requests: {hourly_requests[peak_hour]}")
# Plot hour distribution
hourly_requests.plot(kind='bar', title='Request Distribution by Hour')
plt.xlabel('Hour')
plt.ylabel('Request Count')
plt.show()
```
### Error Rate Analysis
```python theme={null}
# Calculate success and failure counts
status_counts = logs_df['status'].value_counts()
error_rate = status_counts.get('error', 0) / len(logs_df) * 100
print(f"Success rate: {100 - error_rate:.2f}%")
print(f"Failure rate: {error_rate:.2f}%")
# Analyze error types
error_logs = logs_df[logs_df['status'] == 'error']
error_types = error_logs['error_code'].value_counts()
print("\nError type distribution:")
print(error_types)
```
## Export Logs
### Export to CSV
```python theme={null}
# Export full log
logs_df.to_csv('usage_logs.csv', index=False)
# Export filtered results
filtered_logs = logs_df[logs_df['model'] == 'gpt-4-turbo']
filtered_logs.to_csv('gpt4_usage_logs.csv', index=False)
```
### Export to JSON
```python theme={null}
import json
# Export to JSON format
with open('usage_logs.json', 'w') as f:
json.dump(logs['data'], f, indent=2)
```
### Generate Report
```python theme={null}
from datetime import datetime
def generate_usage_report(logs_df, output_file='usage_report.txt'):
"""Generate usage report"""
report = []
report.append("=" * 60)
report.append(f"Usage Report")
report.append(f"Generation time: {datetime.now().strftime('%Y-%m-%d %H:%M:%S')}")
report.append("=" * 60)
report.append("")
# Summary statistics
report.append("Summary Statistics")
report.append("-" * 60)
report.append(f"Total requests: {len(logs_df)}")
report.append(f"Total tokens: {logs_df['tokens'].sum():,}")
report.append(f"Total cost: ${logs_df['cost'].sum():.2f}")
report.append(f"Average cost per request: ${logs_df['cost'].mean():.4f}")
report.append("")
# Model usage
report.append("Model Usage Statistics")
report.append("-" * 60)
model_stats = logs_df.groupby('model').agg({
'request_id': 'count',
'tokens': 'sum',
'cost': 'sum'
})
for model, stats in model_stats.iterrows():
report.append(f"{model}:")
report.append(f" Requests: {stats['request_id']}")
report.append(f" Tokens: {stats['tokens']:,}")
report.append(f" Cost: ${stats['cost']:.2f}")
report.append("")
# Date statistics
report.append("Daily Statistics")
report.append("-" * 60)
daily_stats = logs_df.groupby('date').agg({
'request_id': 'count',
'cost': 'sum'
})
for date, stats in daily_stats.iterrows():
report.append(f"{date}: {stats['request_id']} requests, ${stats['cost']:.2f}")
# Write to file
with open(output_file, 'w') as f:
f.write('\n'.join(report))
print(f"Report generated: {output_file}")
# Generate report
generate_usage_report(logs_df)
```
## Automated Monitoring
### Set Up Alert System
```python theme={null}
def check_usage_anomaly(logs_df):
"""Check for usage anomalies"""
# Check if cost spike occurred
daily_cost = logs_df.groupby('date')['cost'].sum()
avg_cost = daily_cost.mean()
std_cost = daily_cost.std()
# If today's cost exceeds average + 2 standard deviations, send alert
today_cost = daily_cost.iloc[-1]
if today_cost > avg_cost + 2 * std_cost:
send_alert(f"Cost abnormal! Today: ${today_cost:.2f}, Average: ${avg_cost:.2f}")
# Check if error rate spike occurred
recent_logs = logs_df.tail(100)
error_rate = (recent_logs['status'] == 'error').sum() / len(recent_logs)
if error_rate > 0.1: # Error rate over 10%
send_alert(f"High error rate! Current: {error_rate*100:.1f}%")
def send_alert(message):
"""Send alert notification"""
print(f"ALERT: {message}")
# Can integrate email, SMS, Slack and other notification methods
```
### Regular Report Generation
```python theme={null}
import schedule
import time
def daily_report_task():
"""Daily report task"""
# Get yesterday's logs
yesterday = (datetime.now() - timedelta(days=1)).strftime('%Y-%m-%d')
params = {
"start_date": yesterday,
"end_date": yesterday
}
# Get logs
response = requests.get(api_url, headers=headers, params=params)
logs = response.json()
logs_df = pd.DataFrame(logs['data'])
# Generate report
generate_usage_report(logs_df, f'report_{yesterday}.txt')
# Check anomalies
check_usage_anomaly(logs_df)
# Set up scheduled task: run daily at 9 AM
schedule.every().day.at("09:00").do(daily_report_task)
# Keep running
while True:
schedule.run_pending()
time.sleep(60)
```
## Common Questions
**Log Retention Policy:**
* Standard users: 30 days
* Professional users: 90 days
* Enterprise users: 1 year
**Extended Retention:**
* Can purchase extended log retention service
* Support custom retention period
* Support historical log export
**Filtering by API Key:**
In console:
1. Select "Filter by API Key" on log page
2. Choose the API Key you need to view
3. View filtered results
Via API:
```python theme={null}
params = {
"api_key_id": "key_123456",
"start_date": "2024-01-01",
"end_date": "2024-01-31"
}
```
**Log Deletion Policy:**
* Logs cannot be manually deleted (for audit and billing purposes)
* Logs are automatically deleted after retention period expires
* Can contact support for special deletion requests
**Privacy Protection:**
* Logs do not contain sensitive information (like prompts)
* Only statistical information and metadata are recorded
* Can enable "Privacy Mode" to reduce log details
**Timestamp Format:**
* All timestamps use UTC time
* Console can display local time
* API returns UTC timestamps
**Convert to Local Time:**
```python theme={null}
from datetime import datetime
import pytz
# UTC time
utc_time = datetime.strptime(log['timestamp'], '%Y-%m-%d %H:%M:%S')
utc_time = pytz.UTC.localize(utc_time)
# Convert to Beijing time
beijing_tz = pytz.timezone('Asia/Shanghai')
beijing_time = utc_time.astimezone(beijing_tz)
print(beijing_time)
```
**Batch Export:**
1. **Use Pagination**
```python theme={null}
all_logs = []
offset = 0
limit = 1000
while True:
params = {
"limit": limit,
"offset": offset,
"start_date": "2024-01-01",
"end_date": "2024-12-31"
}
response = requests.get(api_url, headers=headers, params=params)
logs = response.json()
if not logs['data']:
break
all_logs.extend(logs['data'])
offset += limit
```
2. **Export in Chunks**
* Export by month to avoid single file being too large
* Use compressed format to reduce storage space
* Consider using database storage instead of files
## Best Practices
### 1. Regular Monitoring
Establish regular monitoring mechanisms:
```
Daily: Check yesterday's usage and cost
Weekly: Generate weekly report, analyze trends
Monthly: Comprehensive monthly review, optimize strategy
```
### 2. Alert Configuration
Set reasonable alert thresholds:
* Cost alert: Set based on daily average + 2 standard deviations
* Error rate alert: Over 10% trigger alert
* Token alert: Abnormally high single request tokens
### 3. Data Backup
Regularly backup important logs:
* Export and save monthly logs
* Use version control to manage reports
* Consider using cloud storage for backup
### 4. Privacy Protection
Protect sensitive information:
* Don't log detailed request content
* Enable log encryption
* Control log access permissions
* Regularly clean up old logs
## Related Resources
* [Token Management](/en/faq/token-management) - Learn how to manage API tokens
* [Insufficient Balance](/en/faq/balance-insufficient) - Handle balance issues
* [API Reference](/en/api-reference/chat-completions) - View API documentation
* [Pricing Description](/en/pricing) - Understand pricing mechanism